
Chapter 4
Up until now, every derivative we have studied (forwards, futures, and swaps) has shared one fundamental characteristic: they are binding obligations. If you buy a forward contract to purchase wheat at $5.00, and the market crashes to $2.00, you cannot back out. You are legally obligated to take the loss. The payoffs of these contracts are straight lines; we call them linear derivatives.
In this chapter, everything changes.
We are introducing a single word that radically alters the mathematical universe of finance: Choice.
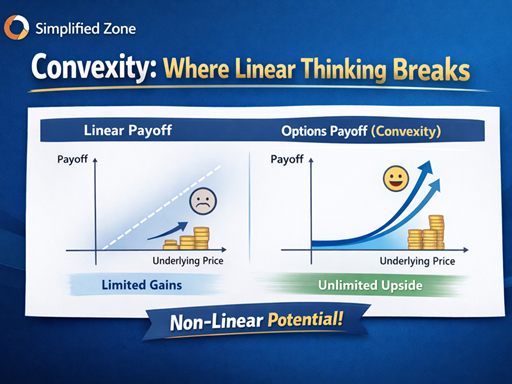
An option contract gives the buyer the right, but emphatically not the obligation, to execute a transaction in the future. By replacing “obligation” with “choice,” we introduce non-linearity, or convexity, into our financial portfolios. This creates asymmetrical risk profiles where your potential losses are strictly capped, but your potential gains can stretch into infinity.
Welcome to the options market.
4.1 Foundational Option Mechanics
To navigate this new world, you need to master a new vocabulary. There are two foundational building blocks in the options universe: the Call and the Put.
The Call Option (The Right to Buy)
A Call option gives the buyer the right to buy the underlying asset at a specific price, on or before a specific date.
- Analogy: Think of a Call option like placing a deposit on a house. You pay the builder $5,000 today for the right to buy the house for $300,000 anytime in the next six months. If the local real estate market booms and the house is suddenly worth $400,000, you exercise your right, buy it for $300,000, and make a fortune. But what if a toxic waste dump is discovered next door and the house value plummets to $100,000? You simply walk away. You don’t buy the house. Your maximum loss is strictly capped at the $5,000 deposit you paid.
The Put Option (The Right to Sell)
A Put option gives the buyer the right to sell the underlying asset at a specific price, on or before a specific date.
- Analogy: Think of a Put option exactly like car insurance. You pay Geico a $500 premium for the right to “sell” your car to them for $20,000 if it gets totaled. If you drive safely all year, the insurance expires worthless. You lost your $500. But if you crash the car, you exercise your right, and Geico is forced to pay you $20,000 for a wrecked piece of metal.
The Core Contract Terms
Every standardized option contract traded on an exchange has three rigid parameters:
- The Strike Price (K): The locked-in price at which the transaction will occur if the option is exercised (e.g., the $300,000 for the house, or the $20,000 for the car).
- The Expiration Date (T): The exact date the contract expires and becomes void.
- The Premium: The upfront cash price the buyer pays to the seller to acquire the contract.
The Asymmetry of Risk (Buyer vs. Seller)
This is the most critical concept to internalize. Because the buyer has the choice, the seller (also called the writer) carries the obligation.
- The Buyer (Long Position): Has strictly capped risk (they can never lose more than the Premium they paid) and potentially unlimited upside.
- The Seller (Short Position): Has strictly capped reward (the absolute most they can ever make is the Premium they collected) and potentially unlimited downside. If you sell a Call option on a stock, and that stock cures cancer and rockets to $10,000 a share, you are legally forced to sell it at the low Strike Price. Your losses could bankrupt you.
4.2 The Concept of Moneyness
Because the underlying stock price is constantly moving, the relationship between the current stock price (the Spot Price) and the option’s Strike Price is dynamic. We categorize this relationship using the concept of Moneyness.
Let’s assume Apple (AAPL) is currently trading in the open market at exactly $150.00 per share.
1. In-The-Money (ITM)
An option is ITM if exercising it right now would yield a positive cash flow.
- Call Example: A Call option with a $140 Strike. (You have the right to buy Apple at $140 when it’s trading at $150. That is a highly valuable right!)
- Put Example: A Put option with a $160 Strike. (You have the right to sell Apple at $160 when it’s only worth $150 in the market).
2. At-The-Money (ATM)
An option is ATM if the Strike Price is exactly equal to the current Spot Price.
- Example: A Call or Put with a $150 Strike.
3. Out-Of-The-Money (OTM)
An option is OTM if exercising it right now would make zero financial sense.
- Call Example: A Call option with a $170 Strike. (Why would you exercise the right to buy Apple for $170 when you can just open your brokerage app and buy it for $150?)
- Put Example: A Put option with a $130 Strike. (Why would you force someone to buy your shares for $130 when you could sell them in the market for $150?)
Note: Just because an option is OTM today does not mean it is worthless. The expiration date might be six months away. Apple could easily rally to $200 by then. Therefore, an OTM option still commands a price in the market.
4.3 Visualizing Risk via Payoff Diagrams
The human brain processes visual geometry far faster than algebra. To survive in the options market, you must learn to instantly mentally visualize a trade’s Profit/Loss (PnL) profile. We do this using Payoff Diagrams.
Imagine a standard graph.
- The X-Axis (Horizontal): Represents the future price of the underlying stock at expiration.
- The Y-Axis (Vertical): Represents your total Profit or Loss on the trade. The horizontal zero-line is your breakeven.
Visualizing the Long Call
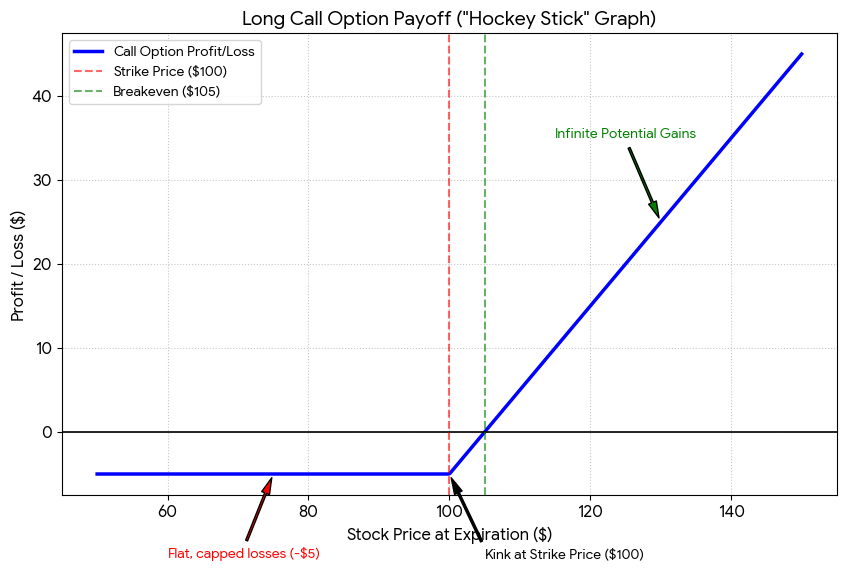
Let’s graph buying a Call option with a $100 Strike for a $5 Premium.
- If the stock drops to $50, $80, or $99, you simply let the option expire. You don’t exercise it. Your loss is exactly $5. On the graph, this looks like a flat, horizontal line below the X-axis at -$5.
- At the $100 Strike Price, the line kinks.
- For every dollar the stock rises above $100, you make a dollar. At $105, you have recovered your $5 premium (You are exactly at the Breakeven point crossing the X-axis).
- At $120, you are up $15. The line slopes upward at a perfect 45-degree angle stretching to infinity.
- The Result: The famous “Hockey Stick” graph. Flat, capped losses on the left, infinite potential gains on the right.
Visualizing the Short Call
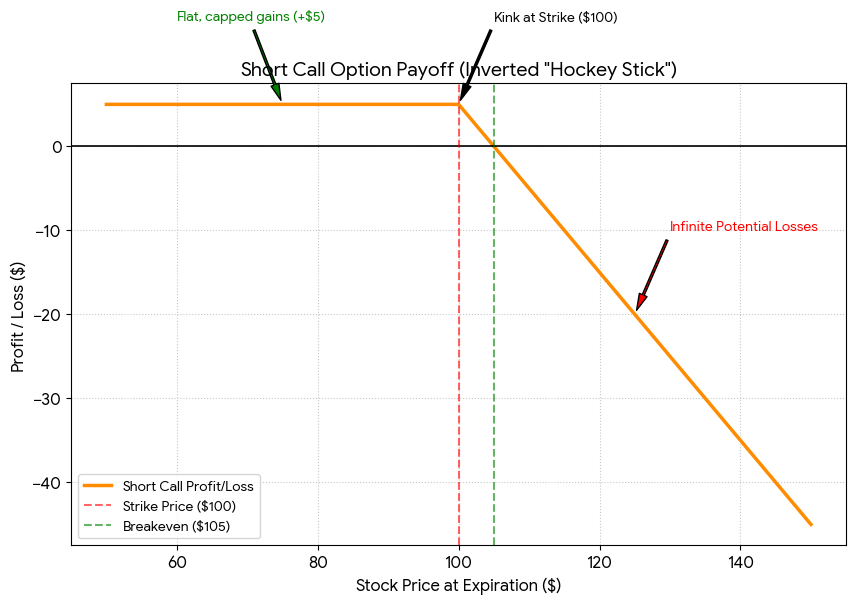
If you sell that exact same option, your graph is the perfect upside-down mirror image of the buyer’s graph.
- You collect the $5 upfront. As long as the stock stays below $100, you keep your $5. It is a flat horizontal line slightly above the X-axis.
- At $100, the line kinks downward.
- If the stock blasts off to $150, you lose $45. Your graph plunges diagonally into an endless abyss of losses.
By mastering these simple “kinked” lines, we will soon be able to stack them on top of each other to visualize highly complex, multi-leg trading strategies without using any complex math.
4.4 Premium Deconstruction: Intrinsic vs. Time Value
When you look at your trading screen, you will see the total price of the option (the Premium). As a financial practitioner, you must instantly mentally separate that Premium into two distinct buckets:
Total Premium = Intrinsic Value + Time Value
1. Intrinsic Value (The “Right Now” Value)
Intrinsic value is strictly defined as the amount by which an option is In-The-Money (ITM). It is the concrete, mathematical value the option would have if it expired right this exact second.
- If Apple is trading at $150, and you own a $140 Call, the intrinsic value is exactly $10.
- Rule: Intrinsic value can never be negative. If an option is Out-Of-The-Money, its Intrinsic Value is exactly $0.
2. Time Value (The “Hope” Value)
If a $140 Call has $10 of Intrinsic Value, but it is trading on the exchange for a total premium of $13, where does that extra $3 come from?
That $3 is the Time Value.
It represents the market’s collective hope (or fear) that the stock will move even further in the money before the expiration date arrives.
- If an option is completely Out-Of-The-Money (Intrinsic Value = $0), then 100% of the premium you are paying is purely Time Value. You are buying pure hope.
As every single day passes, the expiration date gets closer. The amount of “time” for the stock to make a massive move decrease. Therefore, Time Value constantly evaporates. We call this phenomenon Time Decay (or Theta, which we will explore deeply in Module VI).
If you buy options, Time Decay is your worst enemy; it bleeds your account every day. If you sell options, Time Decay is your best friend; you collect that “rent” every day.
<br>
Chapter Summary
- Convexity: Options introduce choice, creating non-linear, asymmetrical risk profiles. Buyers have capped risk and unlimited potential; Sellers have capped rewards and massive risk.
- Mechanics: A Call is the right to buy; a Put is the right to sell. They are governed by the Strike Price and the Expiration Date.
- Moneyness: Categorizes the option’s Strike Price relative to the current Spot price: In-The-Money (ITM), At-The-Money (ATM), and Out-Of-The-Money (OTM).
- Premium Dynamics: The total cost of an option is composed of its real, tangible Intrinsic Value plus its speculative, decaying Time Value.
<br>
Discussion Questions
- If selling options exposes the trader to potentially unlimited, catastrophic losses in exchange for a tiny upfront premium, why would any rational institution ever choose to be an option seller?
- You look at an options chain and see an Out-Of-The-Money call expiring tomorrow trading for $0.10, and an identical OTM call expiring in 6 months trading for $4.00. Since both currently have an Intrinsic Value of $0, what specifically drives the massive difference in their premiums?
- Draw a mental payoff diagram for car insurance (a Put option on your car). Who has the “hockey stick” payoff, you or the insurance company?
Step-by-Step Exercise: Deconstructing the Trade
Let’s practice calculating Moneyness, Intrinsic Value, and Payoffs.
The Setup:
- Current Stock Price (Spot): $50.00
- You buy 1 contract of the $45 Strike PUT Option expiring in 30 days.
- You pay a total Premium of $2.00.
(Remember, standard equity option contracts control 100 shares. So you actually paid $2.00 × 100 = $200 total).
Perform the following analysis:
- Moneyness: Is this Put option currently ITM, ATM, or OTM?
- Premium Deconstruction: What is the Intrinsic Value of this option right now? What is the Time Value?
- Breakeven: The stock price is dropping, which is good for your Put. At what exact stock price at expiration do you break perfectly even ($0 Profit/Loss)?
- Max Profit/Loss: What is the absolute maximum amount of money you can lose on this trade? If the company goes completely bankrupt and the stock goes to $0, what is your total net profit?
(Take your time and map out the cash flows. Getting comfortable with these basic mechanics is mandatory before we start building multi-leg strategies in Chapter 5!)
