
Welcome to the third article in our series on financial data! In our first two outings, we established a solid foundation. We learned that financial data is the language of the markets, and we learned to tame common challenges, from time zones to quality checks.
Now, we’re going to put on a new pair of glasses. We’ll be looking at the world of financial data not just as analysts, but as modern data scientists. To do this, we’ll use a powerful framework known as the “5 Vs of Big Data.” This will help us understand the scale and complexity of the data landscape and prepare us for the exciting world of building predictive models.
The Modern Data Framework: The 5 Vs
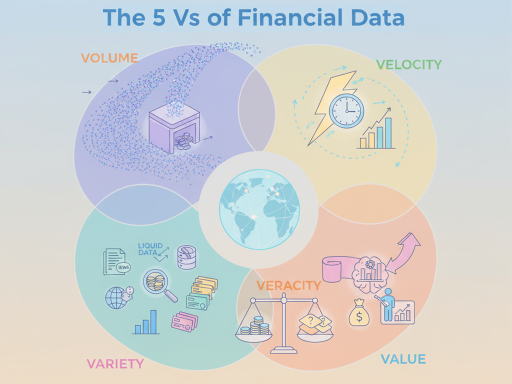
The “5 Vs”, Volume, Velocity, Variety, Veracity, and Value, are a perfect lens through which to view the challenges and opportunities in financial data. Let’s break them down one by one.
1. Volume: The Data Deluge
Volume refers to the staggering amount of data being generated. In the past, analysts might have dealt with daily closing prices. Today, that’s just a drop in the ocean.
Think about a cryptocurrency exchange. It doesn’t just record trades. It records every single change to the limit order book—every new buy order, every cancelled sell order, across hundreds of price levels. This can generate millions, or even billions, of data points every single day for a single asset. Add in every stock, bond, option, and future across the globe, and the scale becomes almost unimaginable. This is the world of high-frequency data, where the story of the market unfolds microsecond by microsecond.
2. Velocity: Data in Motion
Velocity is the speed at which this data is created and needs to be processed. Financial markets are a prime example of high-velocity environments.
- High-Frequency Trading (HFT): Algorithmic trading firms make decisions in millionths of a second, reacting to data as it arrives.
- Real-Time Risk: A bank needs to calculate its risk exposure in real-time, not at the end of the day.
- The Flash Crash: In 2010, the market plunged nearly 1,000 points and recovered in minutes. Models looking at daily, or even hourly, data were blind to the event as it happened. The velocity of the incoming data overwhelmed systems that weren’t built for it.
This speed creates a crucial challenge: we often need to combine data that moves at vastly different speeds. For example, a trading model might use tick-by-tick market data (ultra-high velocity) alongside quarterly GDP reports (ultra-low velocity). Learning to merge these different time scales is a key skill for financial engineers.
3. Variety: A Universe of Data Types
Variety refers to the different forms data can take. This is where the world of finance becomes incredibly rich and complex. The variety exists across multiple dimensions:
A. Data Formats: We have our neat, structured price data. But we also have unstructured data like news articles and social media posts, and semi-structured data like company financial filings.
B. Data Sources: Where does the data come from? There’s a clear hierarchy of quality and detail:
- Primary Sources (The Gold Standard): Direct feeds from exchanges like the NYSE or NASDAQ. This is the rawest, most complete data, often including every quote and trade.
- Financial Platforms: Companies like Bloomberg and Refinitiv(LSEG) that aggregate data from primary sources and add their own analytics.
- Data Vendors: Specialized firms that focus on specific datasets, like corporate actions or sentiment analysis.
- Free Sites: Services like Yahoo Finance are fantastic for learning and individual use but typically provide less granular, end-of-day data.
C. Asset Class Complexity: The variety of data explodes as you move across different asset classes.
- Equities: Relatively simple. For Apple, there is one primary common stock (AAPL).
- Bonds: More complex. Apple has issued dozens of different bonds, each with its own maturity date, coupon, and credit rating.
- Options: The most complex. There are thousands of possible options contracts for Apple stock at any given time. These include different strike prices and different expiration dates. Additionally, there are calls, puts, and more.
4. Veracity: The Quest for Truth
Veracity is about the quality and trustworthiness of the data. Can we believe what it’s telling us? This is where the concept of liquidity becomes a powerful proxy for truth.
Liquidity refers to how easily an asset can be bought or sold without affecting its price. Liquid assets have several key characteristics:
- A small bid-ask spread
- Frequent trading
- High volume
- Small market impact (a single trade doesn’t move the price much)
Think of Microsoft stock (MSFT). On a typical day, millions of shares trade hands. The price you see on the screen is a strong consensus. It is a “truthful” reflection of the market’s collective opinion at that moment.
Now, think of a unique piece of commercial real estate. It might not have traded for years. The “price” is just an estimate. If it finally does sell, the transaction price could be 30% higher or lower than that estimate. The market is illiquid, and the data is far less reliable.
This gives us a golden rule: Be very careful when mixing liquid and illiquid data. The price from a liquid security is rich with up-to-the-minute information. The price from an illiquid security is stale and carries a huge amount of uncertainty.
5. Value: Turning Data into Insight
Finally, we arrive at Value. All the data in the world is useless if we can’t extract valuable insights from it. This is the ultimate goal of any financial data professional.
Extracting value often means looking at a single company from multiple angles. We don’t just want the stock price; we want to understand the business behind it.
Python: A 360-Degree View of a Company
The yahooquery library lets us pull a huge variety of data points, from financial statements to key statistics, for a single ticker.
# First, install the library: pip install yahooquery
from yahooquery import Ticker

# Create a Ticker object for Uber
uber = Ticker("UBER")

# Get the company's business summary
print("--- UBER ASSET PROFILE ---")
# The .get() handles potential empty results gracefully
print(uber.asset_profile.get("UBER", {}).get("longBusinessSummary"))

# Get key financial data
print("\n--- UBER FINANCIAL DATA ---")
print(uber.financial_data.get("UBER"))

# Get key performance indicators
print("\n--- UBER KEY STATS ---")
print(uber.key_stats.get("UBER"))
Output:

This code demonstrates how to pull different facets of structured data for one company. The real value comes when you combine this with unstructured data to build a truly comprehensive view.
One of the biggest traps that destroys value is survivorship bias. This happens when you only include the “survivors” in your historical analysis. For example, if you test a strategy on all the stocks in the S&P 500 over the last 20 years, your results will be artificially inflated. You’ve ignored all the companies that were in the index 20 years ago but went bankrupt or were acquired since. A valuable analysis must include the failures as well as the successes.
Conclusion
Module 1 of our journey is complete! We started with the economic heartbeat of the markets, learned the practical skills to tame wild data, and have now framed our understanding through the modern, powerful lens of the 5 Vs. You now have a comprehensive mental map of the financial data universe.
You understand that data comes in immense Volumes at incredible Velocities. It presents a rich Variety of formats and sources, each with its own level of Veracity. And your ultimate goal is to unlock the Value hidden within. You are no longer just looking at numbers; you are reading the story of the markets, ready to write the next chapter with your own analysis.
